Custom dashboard development
We connect your data sources, map the workflow and build a dashboard your team can trust from day one.
Start a conversation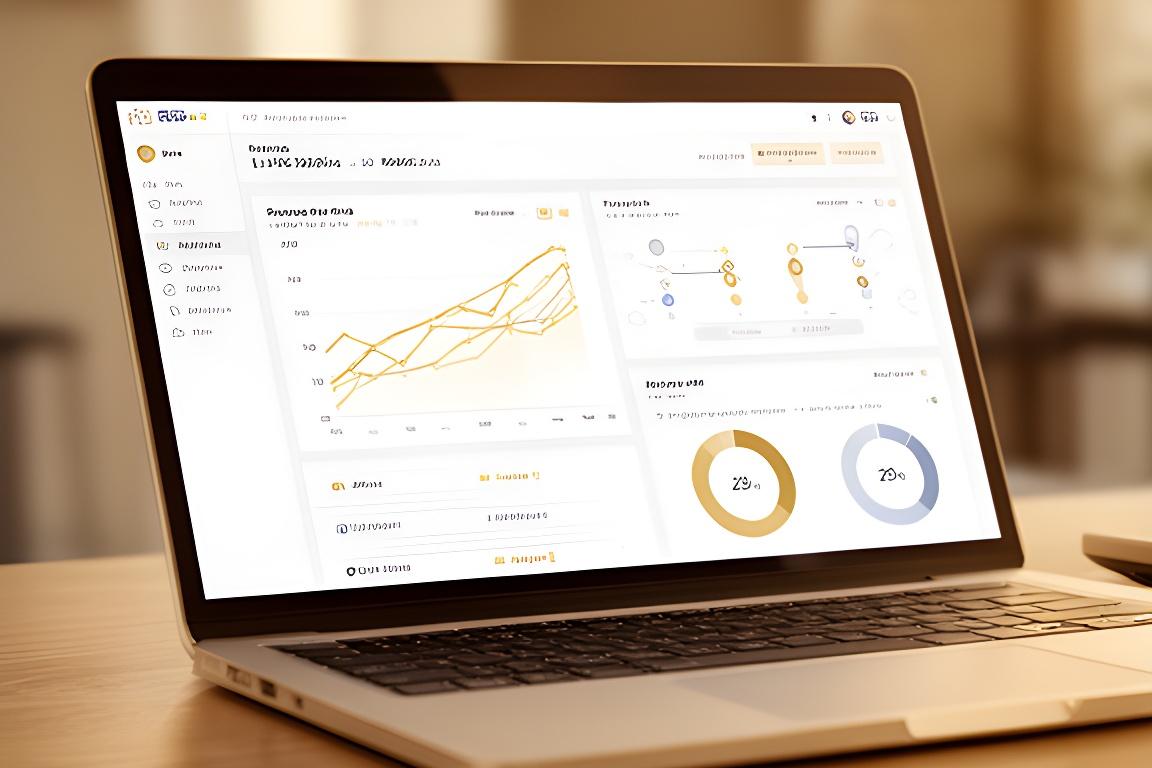
AI analytics UK
Struggling to turn spreadsheets into decisions? Harris Vision builds bespoke dashboards that reveal trends, forecast demand and give your team a clearer next step, without the daily reporting drag.
Trusted by
50+
UK SMEs
Average load time
15 mins
to grasp the core story
Client rating
4.9/5
from London SMEs
Why UK businesses choose us
What makes reporting easier for a dental practice, a pharmacy and a retailer all at once? The answer is structure, clarity and sector-specific detail, not generic charts.
AWS Certified
ISO 27001 aware
98% retention
Fast loading views
Dental
Predictive schedules, treatment funnels and retention alerts in one calm view.
Pharmacy
Inventory forecasting that helps your shelves stay right-sized.
Retail
Customer behaviour and stock performance, side by side.
Construction
Cost prediction, delivery timing and project health, without noise.
“Harris Vision cut our reporting time by 80%.” Dr Emily Clarke, dental practice owner
Our AI dashboard services
Need a full build, a predictive layer or a faster launch? We shape each engagement around the decisions you need to make, not the other way round.
We connect your data sources, map the workflow and build a dashboard your team can trust from day one.
Start a conversationForecast sales, patient flow and inventory needs with models that surface risk before it becomes expensive.
Ask about forecastingTrack KPIs as they change, then trigger alerts that help your team respond with confidence.
Plan live alertsGet a quicker launch with templates shaped around dental, pharmacy, retail, construction, gyms and law firms.
See template optionsSector solutions
Which view would save your team the most time? Choose the sector closest to yours, then imagine the decisions you could make with less guesswork.
Track treatment outcomes, chair utilisation and patient retention with a dashboard your front desk will actually use.
View dental solutionForecast demand, reduce wastage and keep an eye on stock movement in real time.
View pharmacy solutionSee what sells, what returns and what your customers are likely to buy next.
View retail solutionManage project costs, progress and risk signals with less spreadsheet churn.
View construction solutionCalculate your ROI
How many hours do you lose each week to reporting? Use the slider, then get a rough annual saving estimate from an AI dashboard.
Based on an average blended rate of £35 per hour.
Estimated annual saving
£21,840
That’s time your team could spend serving customers, reviewing cases or moving projects forward. Fair trade?
Real results from real clients
Want a quieter inbox and fewer surprises? These clients did, and the shift was visible fast.
Featured case study
A predictive scheduling dashboard highlighted likely gaps early enough for the front desk to act. The team got clearer capacity planning, steadier treatment flow and fewer empty chairs.
Outcome
-30%
patient no-shows
Pharmacy
Cut stock wastage by 20% using demand forecasting that finally matched local patterns.
Retail
Increased repeat purchases by 25% with customer behaviour insights that were easy to act on.
Construction
Completed projects 15% under budget thanks to clearer cost prediction and early risk visibility. What would that certainty mean for your next project?
Law
Brought matter tracking, utilisation and billing patterns together so partners could steer the firm with less friction.
How we build your dashboard
Do you need a long discovery phase? Sometimes yes, but only where the data demands it. We keep the build practical, visible and collaborative.
We learn your goals, review your sources and identify the signals that matter.
Wireframes and prototypes are shaped with your team, so nobody is surprised later.
We connect pipelines and predictive models, then test the outputs carefully.
Your staff get onboarded, questions are answered and refinements happen quickly.
Support continues after launch, because dashboards improve when the business does.
Meet your AI analytics team
We’re local, responsive and easy to talk to. Need a face-to-face review on Islip Street? That’s exactly the sort of conversation we like.

Lead data scientist
Ten years in analytics, with a sharp eye for the metrics people ignore.

UX designer
Makes complex reporting feel simple, clear and quick to use.

Client success manager
Keeps projects moving, questions answered and launches calm. Want a partner who picks up the phone? That’s her lane.
Meet the full teamWhat our clients say
Featured testimonial
Why did we choose Harris Vision? Because they took our messy reporting and turned it into a dashboard that makes sense at a glance. The team were calm, practical and quick to respond, which mattered on busy clinic days.
“The dashboard is a game-changer for our stock management.”
Javi Pygall, Pharmacy Manager
“We finally stopped arguing over spreadsheets and started acting on the same numbers.”
Eilis Cowens, Operations Director
Frequently asked questions
Still deciding? Fair enough. Here are the questions we hear most often from UK SMEs.
Not at all. We design every dashboard for non-technical users, so your team can read it quickly and move on with the job.
Usually from two weeks to two months, depending on complexity, data quality and how many sources need connecting.
Yes. We work with UK GDPR in mind, use encrypted cloud storage and keep access controls tight. Peace of mind matters, doesn’t it?
Yes, we integrate with common EHR, POS and ERP tools, then shape the output around how your team already works.
Free guide
Want a practical starting point? This guide shows the metrics worth tracking across dental, pharmacy, retail and more.
Ready to transform your data into decisions?
Join 50+ UK businesses already growing with AI insights. If you’re based in London, we can talk locally and move quickly.
Contact details
Prefer face-to-face? We’re based in London and happy to meet local businesses that want a more personal partnership.